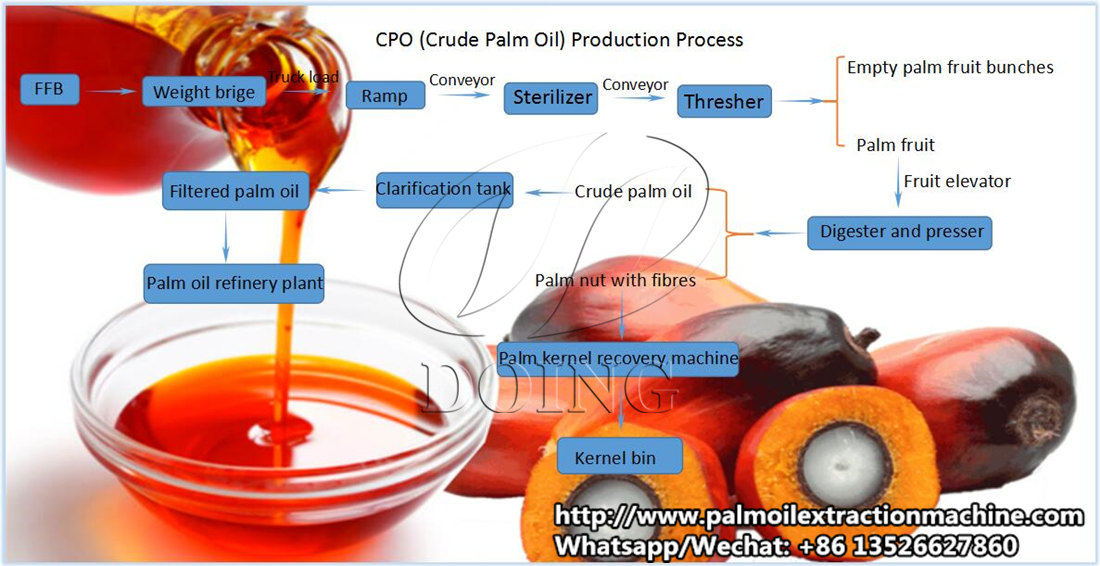
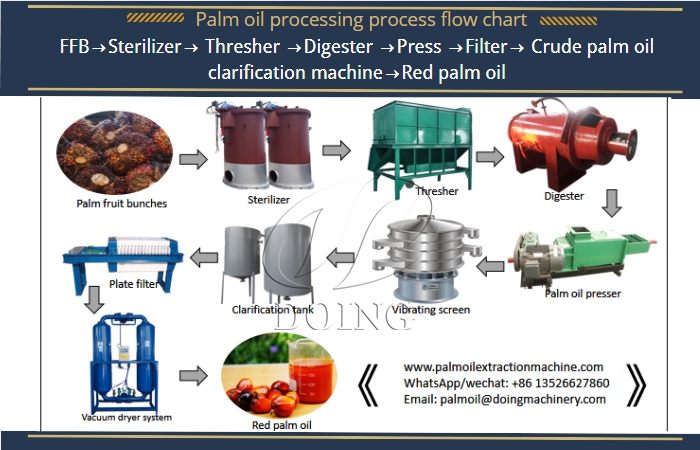
Below is a clear, end-to-end explanation of the Palm Oil Mill (POM) flow process, from Fresh Fruit Bunches (FFB) reception to Crude Palm Oil (CPO) and Palm Kernel (PK)—with key quality parameters and control points at every stage. This is written in a practical mill & management mindset, not just textbook theory.
1. Overall Palm Oil Mill Process Flow


Main sections
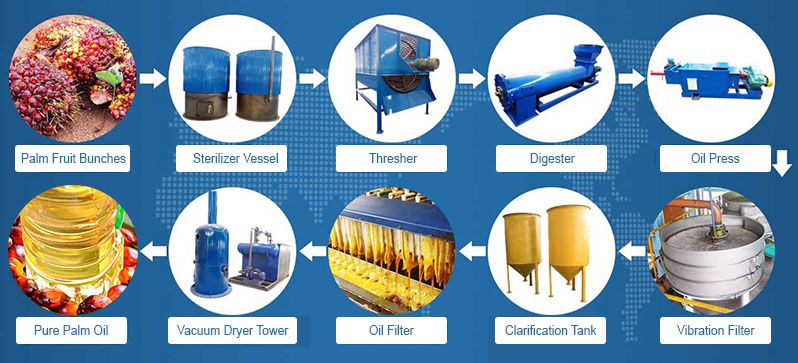
FFB Reception & Grading
Sterilization
Threshing
Digestion
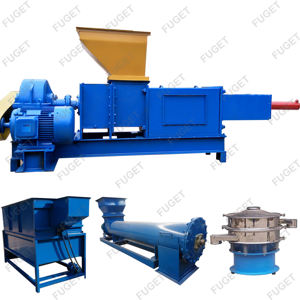
Pressing
Oil Clarification
Purification & Storage
Kernel Recovery
Utilities & Waste Management
2. FFB Reception & Grading (First Quality Gate)
Objective
Ensure only ripe, clean, fresh FFB enters the process.
Key Quality Parameters
| Parameter | Target / Limit |
|---|---|
| Ripeness | ≥ 90% ripe fruits |
| Unripe bunches | < 5% |
| Overripe / rotten | < 3% |
| Long stalk | < 2.5 cm |
| Time to processing | < 24 hours (ideal < 12 h) |
Controls
Visual grading at ramp
Weighbridge recording
FIFO (First In First Out)
Reject or penalize poor-quality FFB
Impact if poorly controlled
❌ High FFA
❌ Low Oil Extraction Rate (OER)
❌ Poor CPO color
3. Sterilization (Most Critical Process Step)
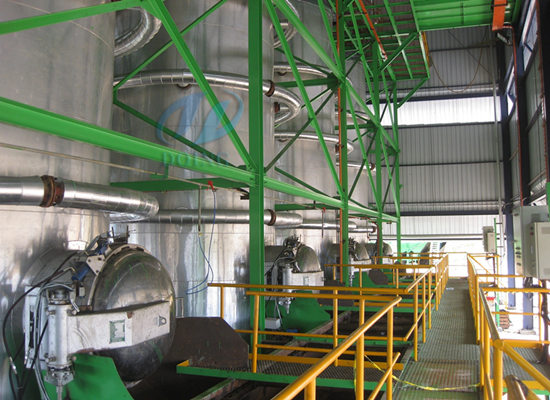
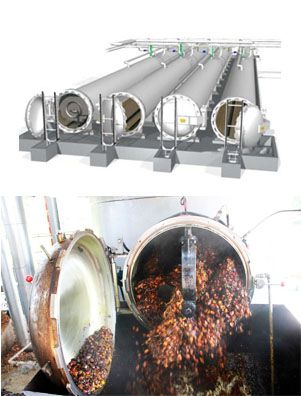
Objective
Stop lipase activity (prevent FFA rise)
Loosen fruits from bunch
Soften mesocarp for oil release
Typical Operating Conditions
| Parameter | Normal Range |
|---|---|
| Steam pressure | 2.8 – 3.0 bar |
| Temperature | 135 – 140°C |
| Time | 85 – 95 min |
| Venting cycles | 2–3 cycles |
Quality Control
Ensure full steam penetration
Avoid under-sterilization (high FFA)
Avoid over-sterilization (dark oil, broken kernels)
Key KPI
FFA increase during sterilization: ≤ 0.1%
4. Threshing (Fruit Separation)
Objective
Separate sterilized fruits from empty bunches (EFB).
Parameters & Control
| Parameter | Control Target |
|---|---|
| Fruit loss in EFB | < 1.5% |
| Thresher speed | Optimized (no fruit damage) |
| EFB cleanliness | Minimal loose fruit |
Risk if poor
❌ Oil loss in EFB
❌ Kernel damage downstream
5. Digestion (Oil Cell Rupture)
Objective
Break oil-bearing cells
Release oil from mesocarp
Operating Parameters
| Parameter | Normal |
|---|---|
| Temperature | 90 – 95°C |
| Retention time | 20 – 30 min |
| Digester speed | Moderate (no emulsification) |
Control Focus
Uniform heating
Avoid over-mixing (oil-water emulsion)
6. Pressing (Oil Extraction Core)
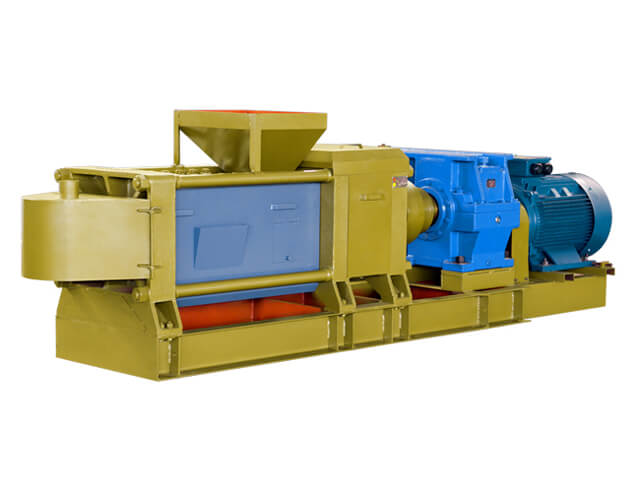
Objective
Extract oil while protecting kernel integrity.
Key Parameters
| Parameter | Target |
|---|---|
| Press pressure | Optimized (not maximum) |
| Press cake oil loss | < 6% |
| Broken kernel | < 5% |
Control Actions
Monitor press amperage
Adjust cone pressure
Check press cake consistency
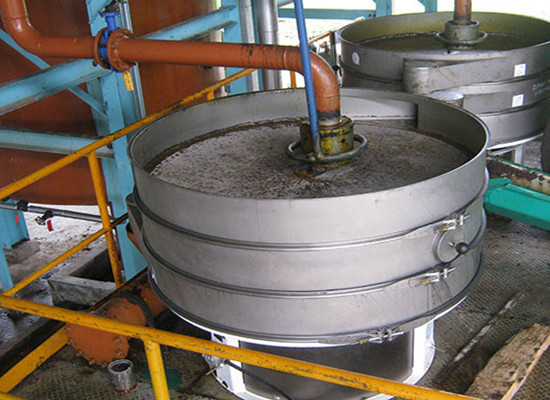
7. Oil Clarification & Purification
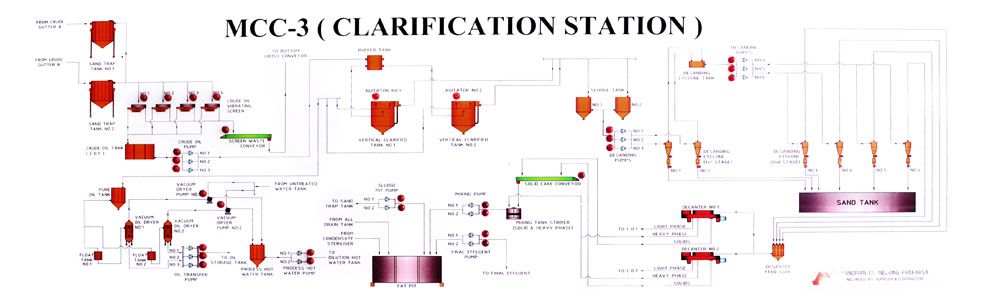
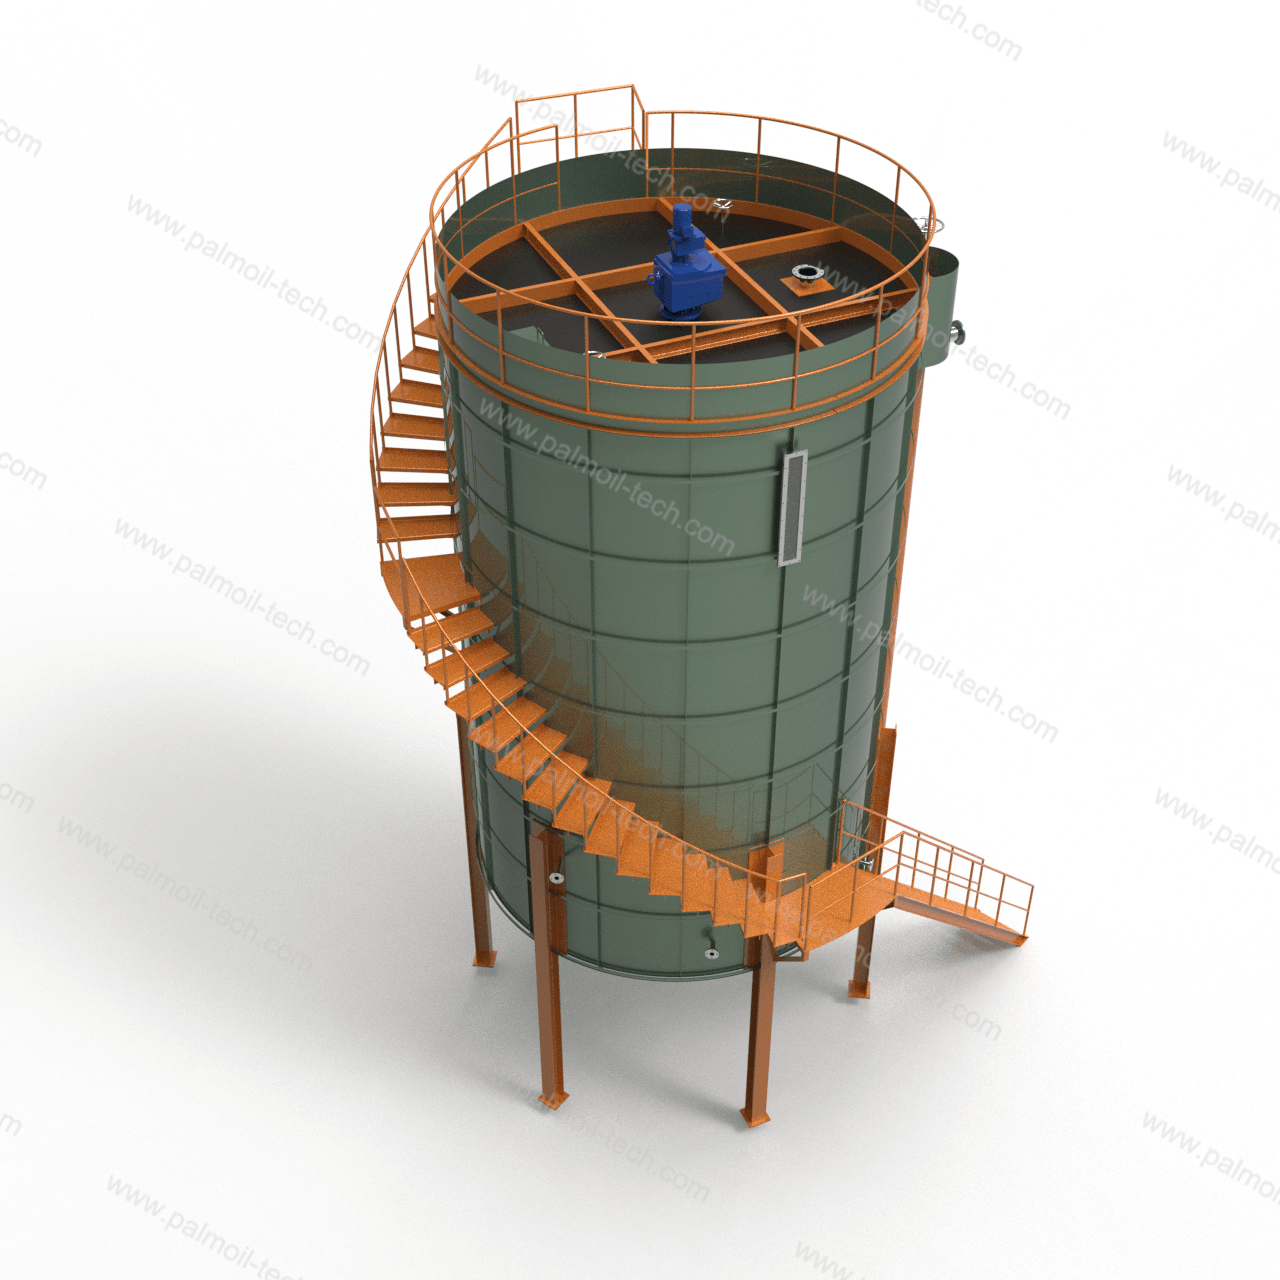
Objective
Separate oil from water, sludge, and solids.
Typical Process
Sand trap → Vibro screen
Crude oil tank
Settling tank / Centrifuge
Purifier → Dryer
Critical Quality Parameters (CPO)
| Parameter | Mill Target |
|---|---|
| FFA | ≤ 3.5% (good mill ≤ 3.0%) |
| Moisture | ≤ 0.25% |
| Dirt | ≤ 0.02% |
| DOBI | ≥ 2.3 |
| Temperature at storage | 45 – 50°C |
Controls
Continuous sludge removal
Oil temperature control
Regular sampling & lab analysis
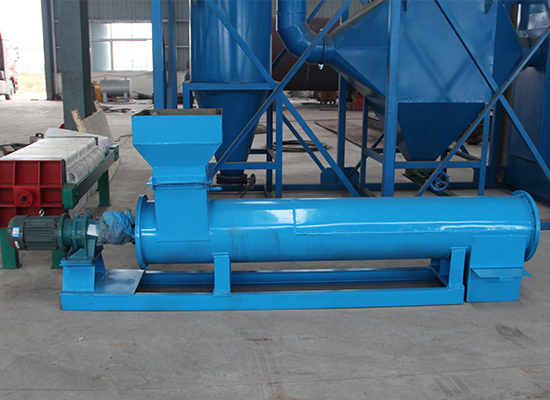
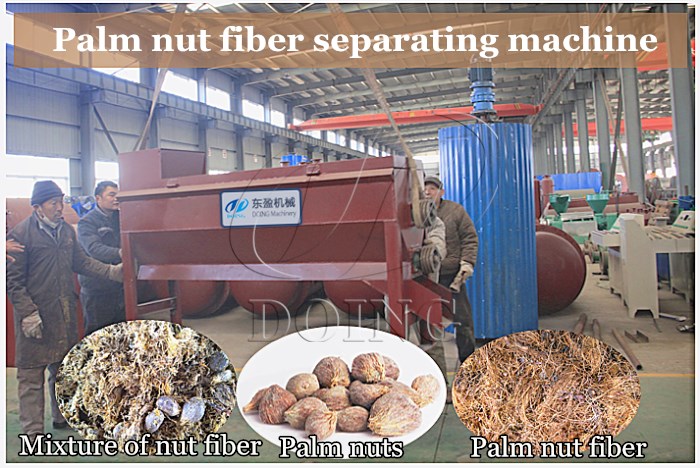
8. Kernel Recovery Plant (KRP)

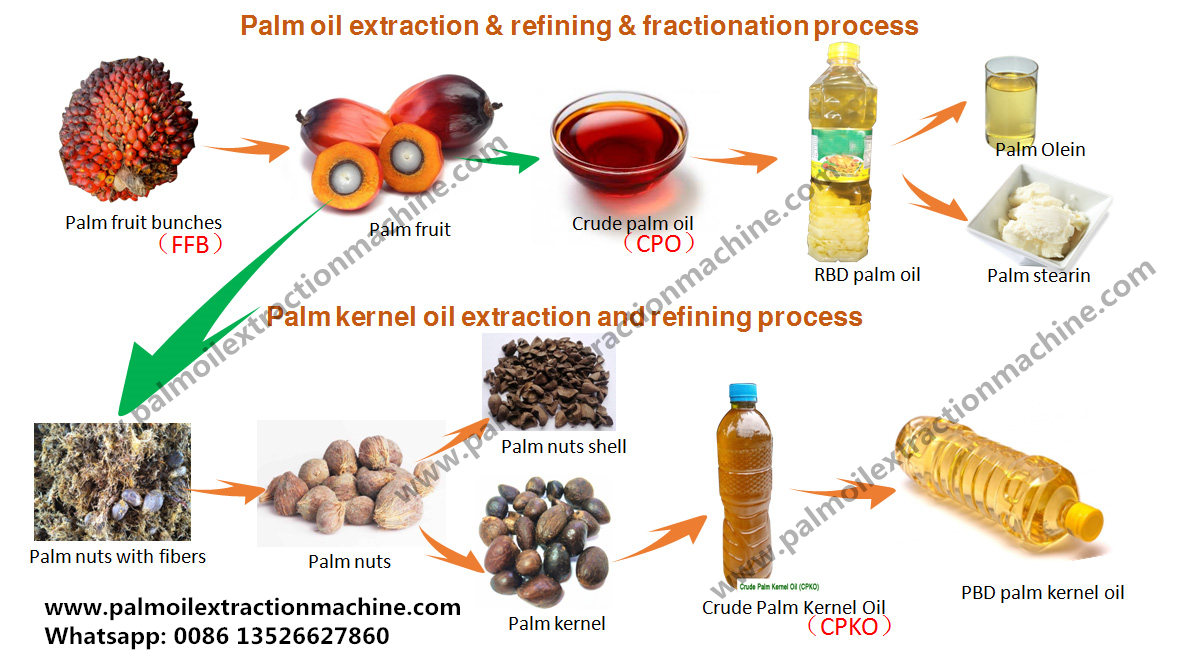

Objective
Recover clean kernels with minimal breakage.
Parameters
| Parameter | Target |
|---|---|
| Kernel loss | < 0.3% |
| Broken kernel | < 5% |
| Shell in kernel | < 2% |
| Kernel moisture | 6 – 7% |
Control Points
Nut drying temperature
Cracker gap setting
Hydrocyclone density control
9. Storage & Dispatch (Final Quality Gate)
Storage Conditions
| Parameter | Control |
|---|---|
| Tank temperature | 45 – 50°C |
| Nitrogen blanketing | Preferred |
| Water bottom | Zero |
| Tank draining | Daily |
Dispatch QC
Composite sampling
Certificate of Analysis (COA)
Traceability record
10. Utilities & Waste Management (Sustainability & Compliance)
By-Products
| Material | Use |
|---|---|
| EFB | Mulch / Compost |
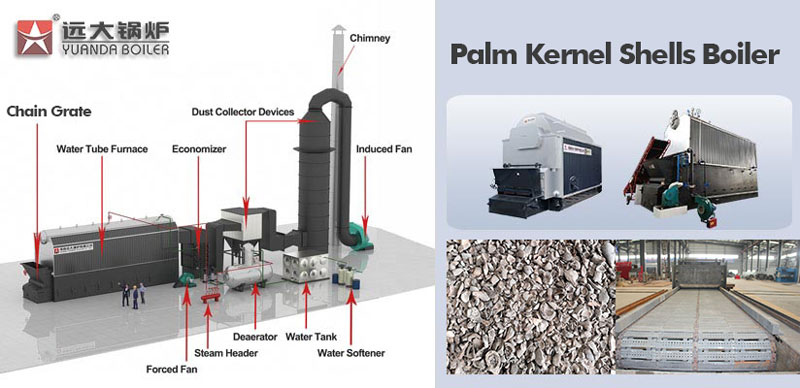
| Fiber & Shell | Boiler fuel |
| POME | Biogas / Treatment |
| Ash | Soil conditioner |
Environmental Controls
Boiler emission limits
POME BOD < regulatory limit
Energy efficiency monitoring
11. Key Mill Performance Indicators (Summary)
| KPI | Good Mill |
|---|---|
| OER | ≥ 20% |
| KER | ≥ 4.8% |
| FFA at dispatch | ≤ 3.0% |
| Oil loss (total) | < 1.5% |
| Downtime | < 5% |
Final Reflection (Operational Wisdom)
Palm oil milling is a race against time, heat, and contamination.
Quality is not “fixed” at the lab—it is designed at the ramp, protected in sterilization, and preserved in clarification & storage.